 Description: The team has difficulty deciding what issues to tackle first, or finds it is overloading itself. This is a typical problem for teams of people accustomed to having their priorities handed down by supervisors, but can also happen because newly empowered employees want to do everything at once. The following solutions assume the team has first created a list of tasks that definitely need to be done or issues that need to be addressed. (Use the first link below if that is not true.)
Techniques:
- Full Scale agile™: “FuSca Light for Startups” (useful for any small team)
- 100 Votes
- Priority Criteria Method
- Pareto Chart
100 Votes
Prepare
- Write the items to be prioritized across the top of the board.
- Say: “For this exercise, each of you will have 100 votes to allocate among the items we need to prioritize. You will want to give the majority of your votes to the most important items. You might want to save some of your votes for items you think should be considered. For example, if you decide five out of seven items are important or need to be considered, you would use five sticky notes. One might say 50, another 30, and the others 10, 5, and 5. Do not feel like you have to vote for every item that has some importance to you. If an item ends up with no votes, the team does not have to delete it; you can simply make it a low priority.”
- Pass out sticky notes, giving several to each team member and leaving more on the table.
Conduct the Vote
- Have members write down the number of votes they want to give each item—one item from the board per note—being sure each members’ notes add up to 100.
- After five minutes, have people place their notes under the related headings on the board.
- Add up the votes for each item.
- If more than five get a large number:
- Remove any with far lower totals from current planning.
Example: Say the votes spread out this way: 360, 316, 270, 213, 202, 197, 183, 93, and 48. There is a large drop from 183 to 93 compared to the gaps between the higher vote-getters. Move the last two items (if not more) out of consideration. - Conduct another vote with the remaining items.
- Remove any with far lower totals from current planning.
- Mark the biggest vote-getter with a 1, the second with a 2, etc., up to 5.
- Get approval from the team for the resulting priority list.
Priority Criteria Method
- Review the “Criteria Method” technique on the “Decision-Making” page.
- Across the top of the board, list the criteria by which you decided upon the existing list of decision items.
Note: Even if you did not use that specific technique in developing the list, you should be able to go back and figure out the criteria from the discussions you had. For example, if everyone talked about the impact on your budget, “Cost” would be one criterion. - List the decision items down the side of the board.
- Draw a table grid of rows and columns including the items and criteria.
- Have the team determine which item best meets each criterion, putting a “1” in each appropriate table cell.
- Have the team repeat the process for the second- and third-best matches, adding a “2” and “3” in the appropriate cells.
- Erase any items that received no numbers.
- Add up the numbers for each remaining item.
- Number the remaining items in order from lowest score to highest to create your priority list.
Pareto Chart
Background
The Pareto principle[1] says that 80 percent of problems are caused by 20 percent of the causes. The numbers are approximate, but the concept has been shown to apply to a wide range of issues. A Pareto Chart clearly identifies the primary causes of a problem. This works best when there is a measurable standard related to the problem.
Steps
- Work with the team to determine:
- The most appropriate measurable standard to use for the issue and the current data.
Example: If the issue is “safety,” you could use safety rule violations or injuries within a given period of time. - Causes of the problem.
- How much of the figure is created by each cause.
Example: If there were 47 injuries in the past year, you might know 23 were due to workers not following procedures, 14 to lack of basic skills, etc. The sum of these figures must total 47 (see the table below).
- The most appropriate measurable standard to use for the issue and the current data.
- After the meeting, calculate the percentage of the total count represented by each cause.
Example: If 23 of the 47 injuries were due to the first cause, that is around 49 percent. - Create a table and/or chart like those below.
- Distribute the table or chart to the team.
- At the next meeting, determine how far down the list of causes the team should go in its problem solving, bearing in mind the costs of fixing each.
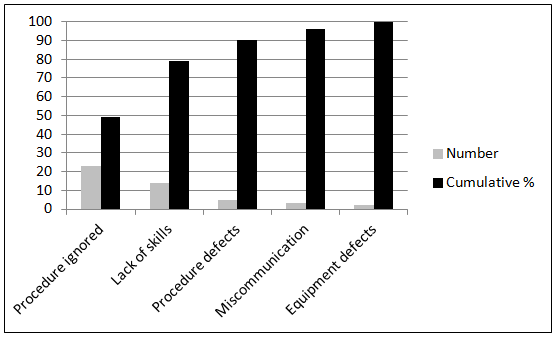
Example: Based on the table and chart below, “Procedure ignored” and “Lack of skills” are the main reasons for the injuries, causing 79%. Clearly these must be addressed as quickly as possible. But that should not stop you from addressing smaller causes that are quick and cheap to fix, like “Procedure defects.”
Sample Pareto Table
| Cause | Number | % | Cumulative % |
| Procedure ignored | 23 | 49 | 49 |
| Lack of skills | 14 | 30 | 79 |
| Procedure defects | 5 | 11 | 90 |
| Miscommunication | 3 | 6 | 96 |
| Equipment defects | 2 | 4 | 100 |
| Totals | 47 | 100 | — |
Note: “Cumulative” percentage adds the percentage figure from each row to the sum of the higher rows.
Sample Pareto Chart
[1] Named for economist Vilfredo Pareto by management consultant Joseph Juran, who came up with the concept based on an observation by Pareto about the distribution of wealth in the early 1900s. The examples is this text are imprecise, because you would really want to estimate the cost/benefit ratios for fixing each cause and apply the Pareto rule to those.